NetworkX basics
In this guide you'll learn how to:
- differentiate NetworkX graph types,
- create a graph by generating it, reading it or adding nodes and edges,
- remove nodes and edges from the graph,
- examine a graph,
- write a graph to a file.
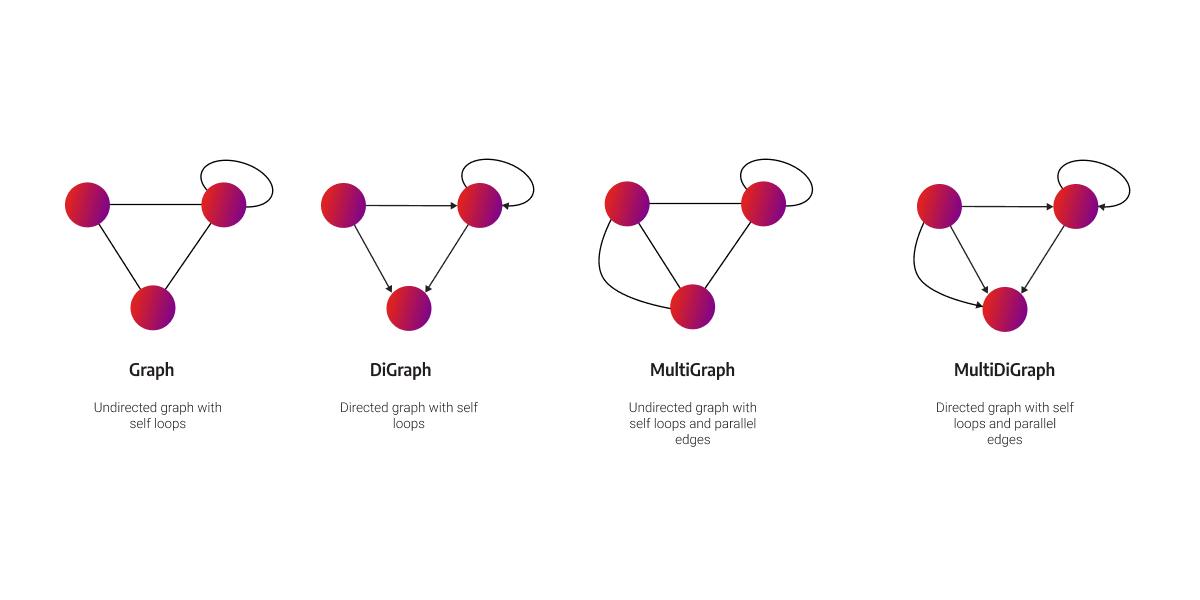
NetworkX graph types
The model of the graph structure in NetworkX is similar to the labeled-property graph. Regarding the naming convention, relationships are called edges, and properties are called attributes in NetworkX. You can use the following NetworkX graph classes:
Graph creation
NetworkX graph objects can be created in three ways:
- using the graph generators - standard algorithms to create network topologies,
- by reading from different formats,
- by adding nodes and edges explicitly.
It is also possible to remove nodes and edges from your graph.
Graph generators
There are many types of graph generators inside NetworkX. They create predefined network structures, so that you can continue on exploring it and learning more about graph algorithms. Some of the most often used generators are:
balanced_tree()complete_graph()cycle_graph()star_graph()karate_club_graph()
Example:
- Python code
- Output
Let's generate and draw Zachary’s Karate Club graph with the following Python code:
import networkx as nx
import matplotlib.pyplot as plt

generated_graph = nx.karate_club_graph()
pos = nx.spring_layout(generated_graph, scale=0.5)
nx.draw(generated_graph, pos)

plt.show()
The output of the previous Python code looks like this:
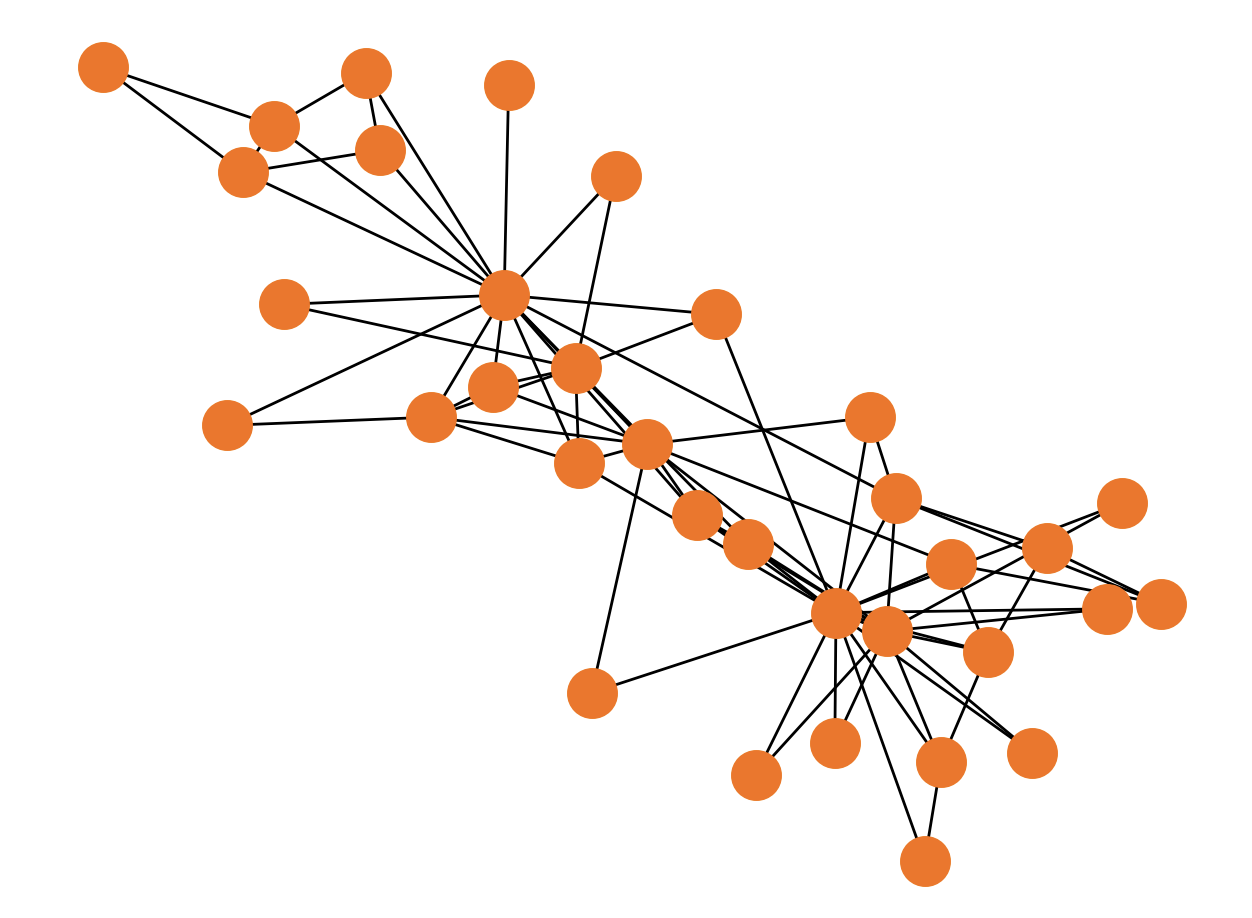
This kind of graph creation is good enough for testing, but be careful, since each time you start your script, the data has to be loaded in-memory. To learn more about it, head over to our FAQ.
Reading graphs
Data can be imported from many different sources and file formats: Adjacency List, Multiline Adjacency List, Edge List, GEXF, GML, Pickle, GraphML, JSON, LEDA, SparseGraph6, Pajek, GIS Shapefile and Matrix Market.
Check out the example below to see how to read a graph from CSV file.
- CSV file
- Python code
- Output
Let's say we have the following graph.csv file:
source,target
1,2
1,3
2,3
1,4
2,4
3,4
1,5
1,6
Let's import the graph.csv file and draw the graph:
import networkx as nx
import matplotlib.pyplot as plt
import pandas as pd

graph_type = nx.Graph()
df = pd.read_csv('graph.csv')
G = nx.from_pandas_edgelist(df, create_using=graph_type)

nx.draw(G)
plt.show()
The output of the previous Python code looks like this:
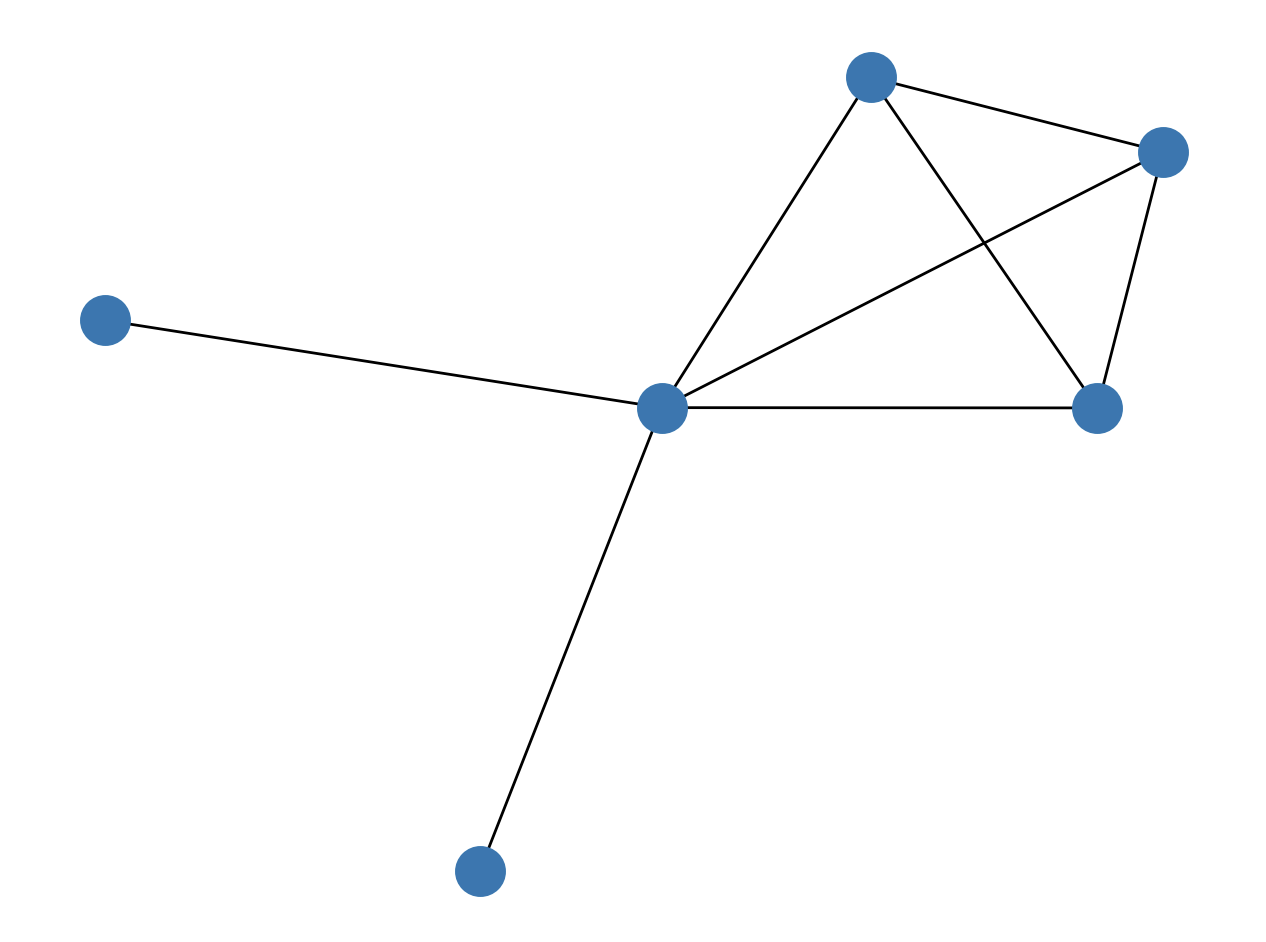
This kind of graph creation is great and fast for smaller datasets. If your dataset becomes too large, you can run into memory issues. Read more about it here.
Adding nodes and edges
All NetworkX graph classes allow hashable Python objects (except None) as nodes. Hashable objects include a text string, an image, an XML object, another Graph, a customized node object, and more. Nodes can be added and manipulated by using the following methods:
G.add_node(node)- add a single node to graphGG.add_nodes_from(nodes)- add nodes from container of nodes to graphGG.remove_node(node)- remove node from all adjacent edges from graphGG.remove_nodes_from(nodes)- remove nodes from container of nodes from graphG
Edges often have data associated with them. Any Python object can be assigned as an edge attribute. Edges can be added and manipulated by using the following methods:
G.add_edge(u, v)- add edge between nodesuandvin graphGG.add_edges_from(ebunch)- add edges from the container of edges to graphGG.add_weighted_edges_from(ebunch)- add weighted edges from the container of edges to graphGG.remove_edge(u, v)- remove edge between nodesuandvfrom graphGG.remove_edges_from(ebunch)- remove edges from list or container of edge tuples from graphG
Check out the usage of the above procedures in the following example.
- Python code
- Output
The following Python code shows how to add one or multiple nodes and edges. It will also draw a graph with Matplotlib library.
import networkx as nx

import matplotlib.pyplot as plt

g = nx.Graph()

# Adding one node
g.add_node("1", label="Person", name="Kevin Bacon", age=64)

# Adding multiple nodes
g.add_nodes_from(
    [
        ("2", {"label": "Person", "name": "Ian McKellen", "age": 83}),
        ("3", {"label": "Person", "name": "James McAvoy", "age": 43}),
        ("4", {"label": "Person", "name": "Michael Fassbender", "age": 45}),
    ]
)

# Adding one edge
g.add_edge("1", "3", type="ACTED_WITH")

# Adding multiple edges
g.add_edges_from([("1", "4"), ("2", "3"), ("2", "4")], type="ACTED_WITH")

# Graph drawing
pos = nx.circular_layout(g)
nx.draw(g, pos, node_size=10000)

labels = nx.get_node_attributes(g, "name")
edge_labels = nx.get_edge_attributes(g, "type")

nx.draw_networkx_labels(g, pos, labels=labels, font_size=10, font_color="white")
nx.draw_networkx_edge_labels(g, pos, edge_labels=edge_labels, font_size=10)

plt.show()
The output of the previous Python code looks like this:
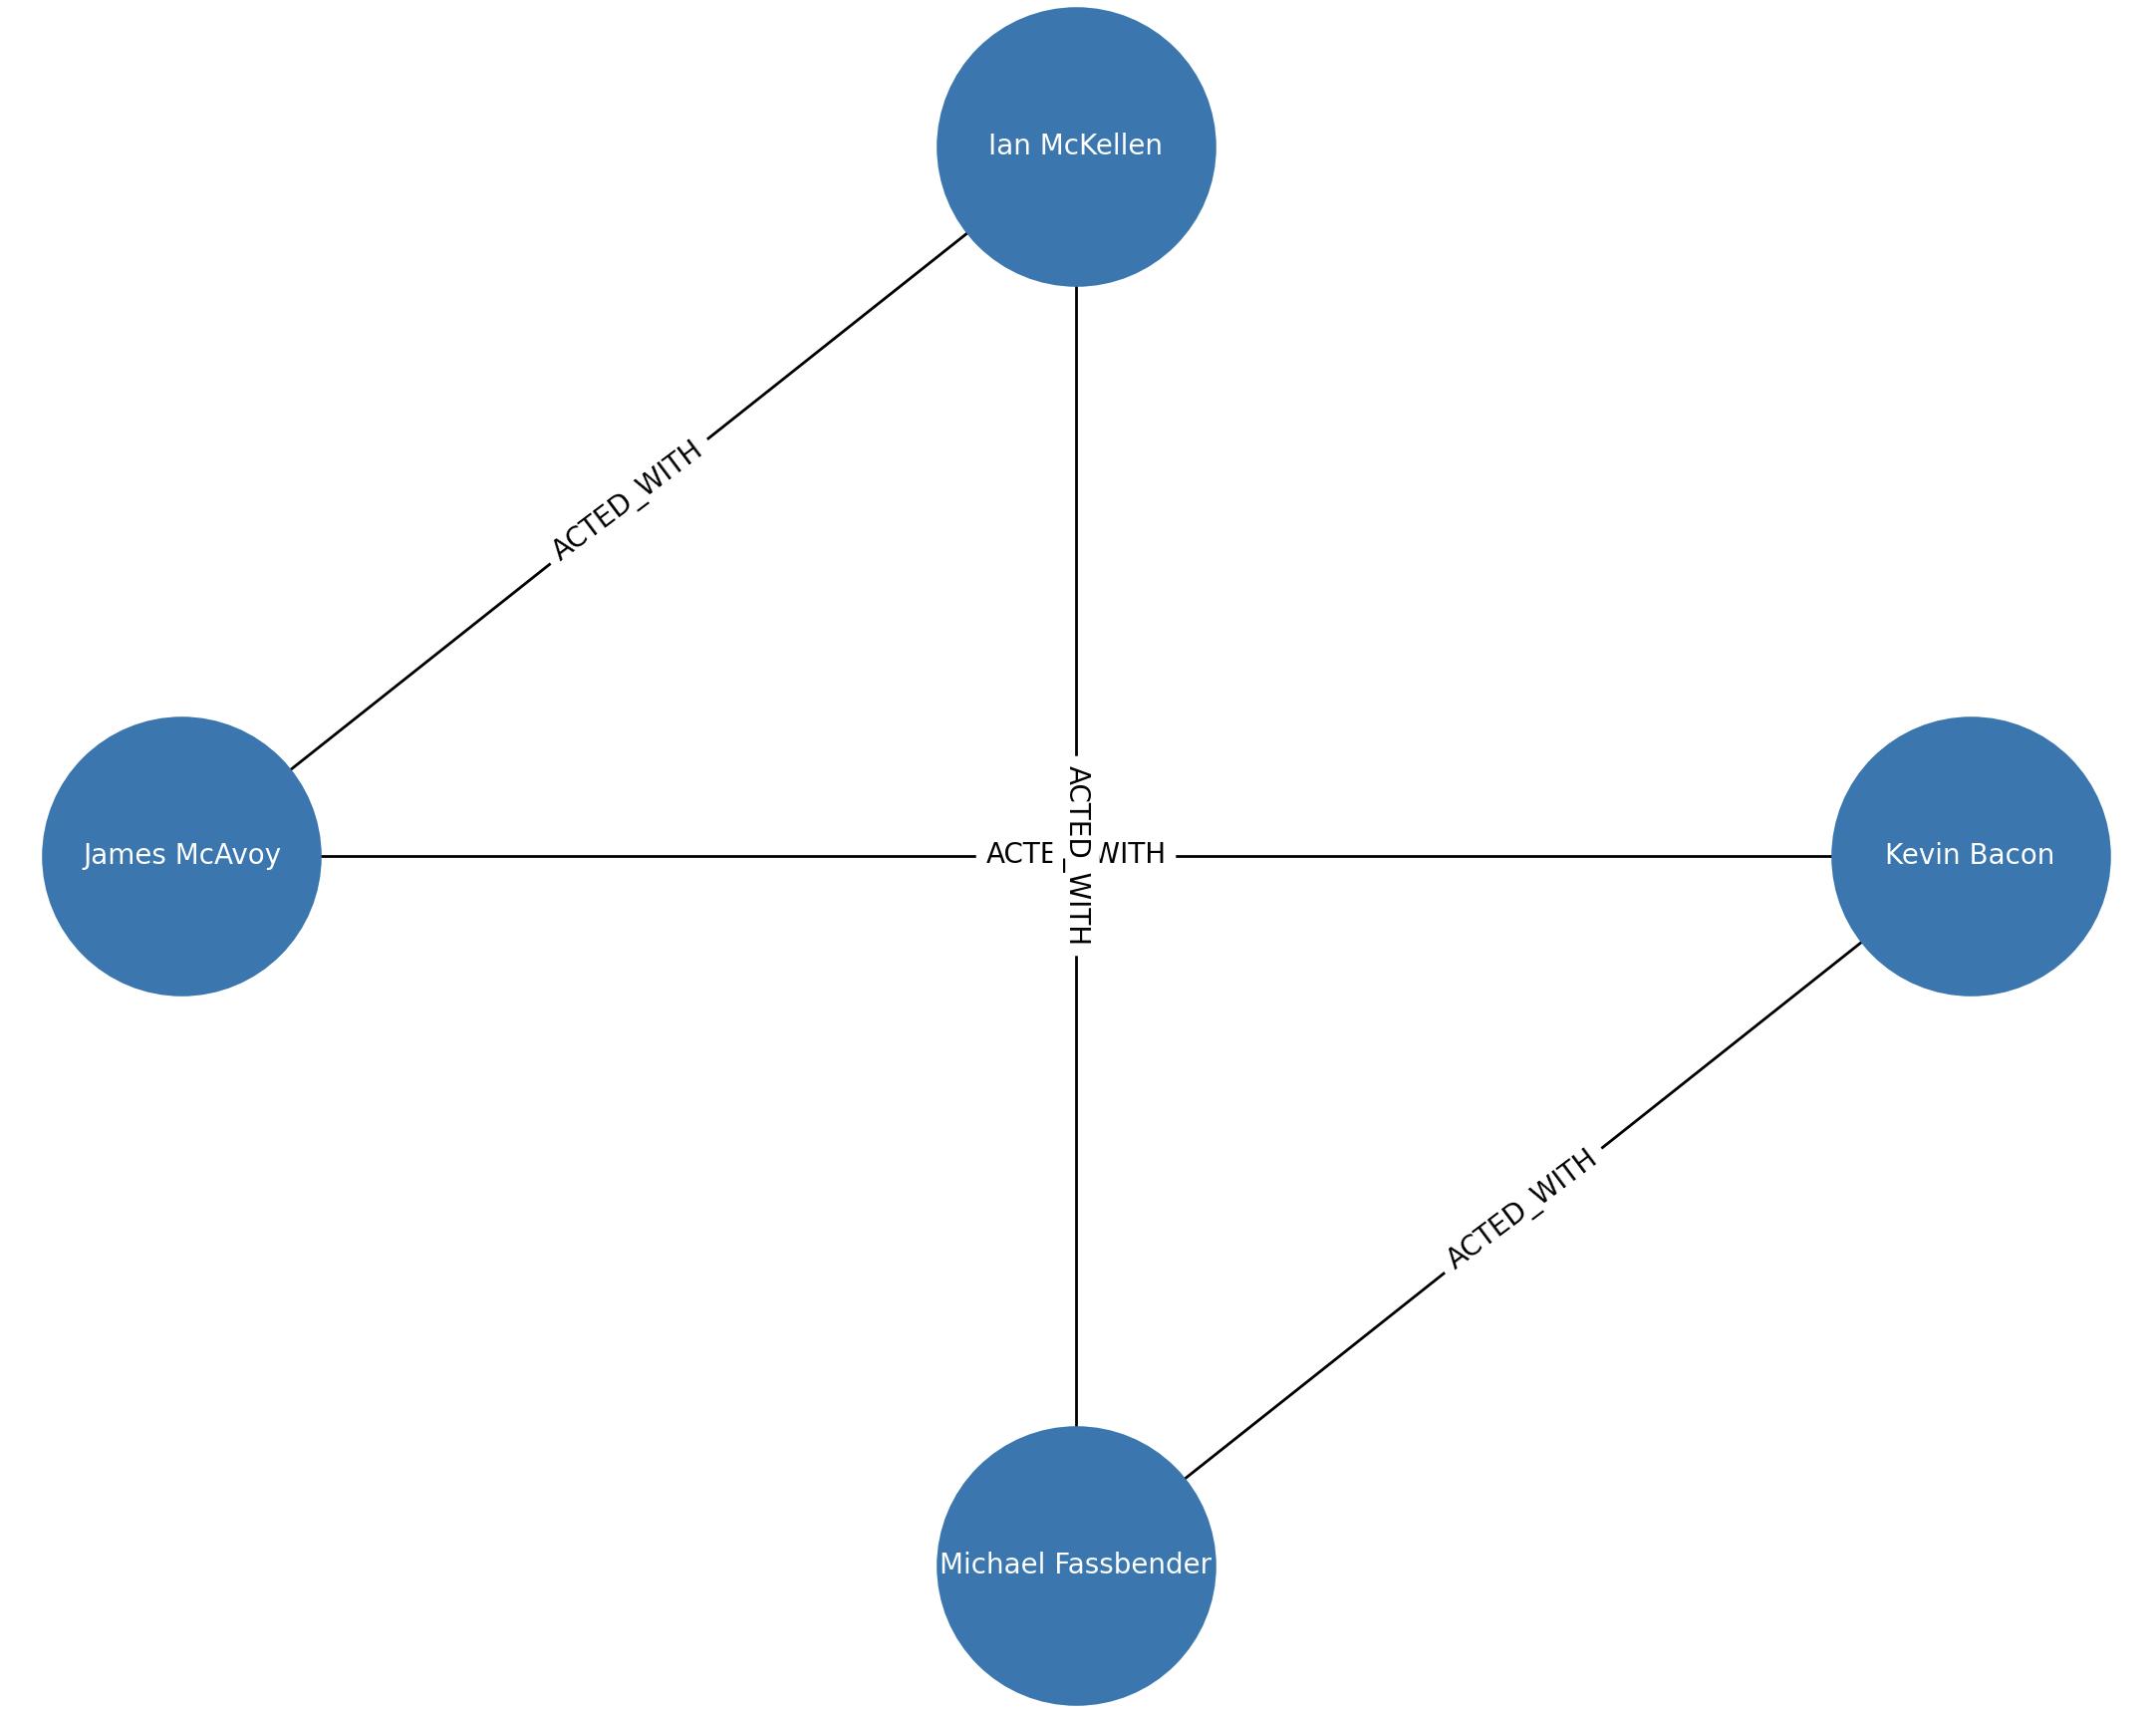
This kind of graph creation is great and fast for smaller datasets. If your dataset becomes too large, you can run into memory issues. Read more about it here.
Removing nodes and edges from the graph
The following methods are used to remove nodes and edges:
Graph.remove_node()Graph.remove_nodes_from()Graph.remove_edge()Graph.remove_edges_from()
Check out the usage of the above procedures in the following example.
- Python code
- Output
The following Python code shows how to remove one or multiple nodes and edges.
import networkx as nx

g = nx.Graph()
g.add_nodes_from([1, 2, 3, 4, 5, 6])
g.add_edges_from([(1, 2), (2, 3), (3, 4), (3, 5), (4, 5), (4, 6), (5, 6)])
print(g.nodes)
print(g.edges)

g.remove_node(1)
print(g.nodes)
print(g.edges)

g.remove_nodes_from([2, 3])
print(g.nodes)
print(g.edges)

g.remove_edges_from([(4, 5), (4, 6)])
print(g.nodes)
print(g.edges)
The output of the previous Python code looks like this:
[1, 2, 3, 4, 5, 6]
[(1, 2), (2, 3), (3, 4), (3, 5), (4, 5), (4, 6), (5, 6)]
[2, 3, 4, 5, 6]
[(2, 3), (3, 4), (3, 5), (4, 5), (4, 6), (5, 6)]
[4, 5, 6]
[(4, 5), (4, 6), (5, 6)]
[4, 5, 6]
[(5, 6)]
Notice how when the node 1 was removed, all edges incident with the removed node were also removed from the graph.
Graph examination
Let's define a simple graph G.
import networkx as nx

g = nx.Graph()
g.add_nodes_from([1, 2, 3, 4, 5, 6])
g.add_edges_from([(1, 2), (2, 3), (3, 4), (3, 5), (4, 5), (4, 6), (5, 6)])
To list the nodes and edges in the graph use the following code:
- Python code
- Output
print(G.nodes)
print(G.edges)
The output of the previous Python code looks like this:
[1, 2, 3, 4, 5, 6]
[(1, 2), (2, 3), (3, 4), (3, 5), (4, 5), (4, 6), (5, 6)]
To check out its number of nodes or edges, use the number_of_nodes() and number_of_edges() methods.
- Python code
- Output
print(G.number_of_nodes())
print(G.number_of_edges())
The output of the previous Python code looks like this:
6
7
To check degrees of a set of nodes, that is, with how many edges those nodes are incident with, use G.degree() method.
- Python code
- Output
print(G.degree([4, 5]))
The output of the previous Python code looks like this:
[(4, 3), (5, 3)]
Writing graphs
NetworkX graph can be exported from many different sources and file formats: Adjacency List, Multiline Adjacency List, Edge List, GEXF, GML, Pickle, GraphML, JSON, LEDA, SparseGraph6, Pajek, GIS Shapefile and Matrix Market.
In the below example you can see how to export graph into three different file formats - Adjacency List and GML.
- Python code
- Adjacency List
- GML
import networkx as nx

G = nx.petersen_graph()
nx.write_adjlist(G, "graph.adjlist")
nx.write_gml(G, "graph.gml")
nx.write_graphml(G, "graph.graphml")
# Petersen Graph
0 1 4 5
1 2 6
2 3 7
3 4 8
4 9
5 7 8
6 8 9
7 9
8
9
graph [
  name "Petersen Graph"
  node [
    id 0
    label "0"
  ]
  node [
    id 1
    label "1"
  ]
  node [
    id 2
    label "2"
  ]
  node [
    id 3
    label "3"
  ]
  node [
    id 4
    label "4"
  ]
  node [
    id 5
    label "5"
  ]
  node [
    id 6
    label "6"
  ]
  node [
    id 7
    label "7"
  ]
  node [
    id 8
    label "8"
  ]
  node [
    id 9
    label "9"
  ]
  edge [
    source 0
    target 1
  ]
  edge [
    source 0
    target 4
  ]
  edge [
    source 0
    target 5
  ]
  edge [
    source 1
    target 2
  ]
  edge [
    source 1
    target 6
  ]
  edge [
    source 2
    target 3
  ]
  edge [
    source 2
    target 7
  ]
  edge [
    source 3
    target 4
  ]
  edge [
    source 3
    target 8
  ]
  edge [
    source 4
    target 9
  ]
  edge [
    source 5
    target 7
  ]
  edge [
    source 5
    target 8
  ]
  edge [
    source 6
    target 8
  ]
  edge [
    source 6
    target 9
  ]
  edge [
    source 7
    target 9
  ]
]
This NetworkX feature is often being used when a lot of time is wasted on the graph loading each time you want to analyze the graph. This happens because NetworkX has to load graph in memory on each run. You can find an answer on what is the best solution to avoid performance loss due to graph loading in our FAQ section.
Where to next?
There are many other learning resources, such as courses, whitepapers and blog posts. With the help of these valuable resources, you can learn more about the importance of graph analytics and which tools are out there to help you. Also, if you run into a common NetworkX problem, don't forget to check out our FAQ section.